IT STARTS WITH UNDERSTANDING PERFORMANCE
Let’s start with the problem that you have seen me write about again, again and again.
Perry Marshall’s book – The 80/20 of Sales and Marketing created a major shift in how I think and go about talking to prospects about their sales team and its ability or inability to demonstrate consistent and predictable sales growth. Everything, and I MEAN EVERYTHING, starts with an understanding of how your sales team is performing.
IS THERE A PROBLEM?
This exercise identifies if there is a problem or not. It really IS that simple. All you have to do is a little simple math and then answer the question – Is this a problem?
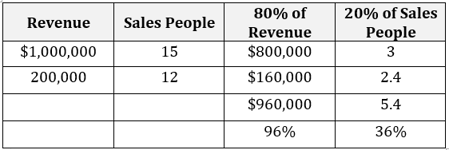
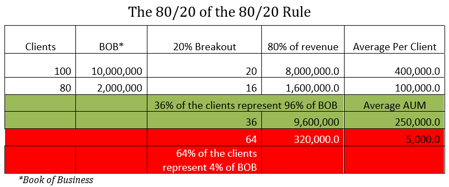
I recently reviewed the productivity of a group we are in discussions with. Nothing is final yet as the company is in that early step of the process – trying to determine if there is a problem. To help them in the process, we sign the NDA and ask for their production numbers. I get the numbers, stack rank them and start applying the 80/20 rule. I don’t follow the exact procedure; instead, I just take the number of people on the list and break the group into fifths. If I have 100 salespeople, I end up with 5 groups of 20. Then, I just do the math.
- What percentage of the total is being produced by the top quintile?
- What percentage of the total is being produced by the middle quintile?
- How much is being produced by the 5th quintile?
ACTUAL NUMBERS MAY BE DISTURBING
The findings were not startling in and of themselves because the top two fifths closely resembled what you would expect from the 80/20 rule. What was interesting (and what would interest you) was the discussion about the bottom two fifths. When we discovered that the bottom two fifths generated less than 5% of the total revenue, we then got into the compensation/revenue discussion.
- How much is 5% of the total revenue?
- How much in compensation alone is it costing to generate that 5% of revenue?
TIME FOR THE “LET’S PRETEND” EXERCISE
I won’t go into all the details, but when we played “let’s pretend”, then everyone in the room got real serious.
- “Let’s pretend that we fired all of those people in the bottom two fifths, how much would that save in compensation alone?”
- Subtract the revenue
- What’s the profit?
I assure that in most, if not all, companies (I suggest you stop reading and do this right now) the profit is significant. So much so that it starts a really good debate that starts with the question:
Why in the heck are those people still with us?
GET RESULTS WITH AN ESTABLISHED PROCESS
The discussion was robust, honest, helpful and productive. And, yes, they all agreed that they have a “have to fix” problem. But my post today isn’t just about getting to a point where you can determine a problem and the severity of the problem, but more about the cost of the approaching the solution the right way.
Understand we don’t get to close all the opportunities we engage in. We don’t get them all because, at the risk of sounding arrogant, not everyone qualifies (We just failed to make the cut on a recent opportunity because of our commitment to the process). Our process, just as yours should be, follows a fairly strict set of guidelines. We follow these guidelines because we know we can guarantee results when they are followed. We have experiences from early on in our business when we didn’t follow the guidelines – we didn’t get results and we didn’t keep the relationship.
INVALUABLE DATA FROM THE RIGHT ASSESSMENT TOOL
The primary step in our approach is the use of an assessment tool. Specifically, we use the Objective Management Sales Effectiveness and Impact Analysis (SEIA). It gives our new clients and us everything we need to impact revenue, profit and growth. Let me explain by using one of the tools we get from the SEIA. (see chart below)
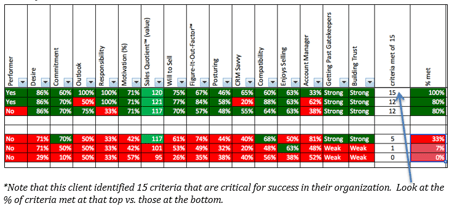
This chart represents those people in a sales organization that are succeeding and failing the most. Assuming for a minute that you don't understand the meaning of the headings, just look at the colors: Green is good, red is bad, high numbers good, low numbers bad. The first column identifies if the people are performing to goal or not. The only anomaly in the group is the third person from the top. I inquired about this and there are two pieces of information that are good to know.
- The data we collected on performance was based on the previous years sales.
- The manager answering the question “Is this person performing as expected” answered the question for the current year.
So, what we have is someone that performed exceedingly well in one year and is now failing. What the graph helps the manager do is have a very significant discussion on “why” there is a change. I won’t go into all the details as to what that discussion should sound like, but now the manager has some interesting data to look at and digest in order to help frame the narrative of the required intentional coaching session to be scheduled.
TIME TO GET REAL - THE BOTTOM LINE
What I believe is most important is to get arms around the total picture provided by hard data and assessment data. What we know is the following:
- Coaching the top group will be effective because they are coachable and have the will to sell
- Investing in the bottom group will bring little or no return:
- They lack desire
- They lack commitment
- They have a poor outlook
- They won’t take responsibility
- And they are not motivated to succeed in selling
- You can assume (because I did further analysis) that at least one of the other fifths in the organization looks like the top group and one looks like the bottom group.
- The one fifth that looks like the top group may not hit the top ranking because they lack tenure in the company or in the business.
- There is at least one other group that looks like the bottom quintile. They may or may not be new. In this case, the bottom quintile we are illustrating is NOT at the bottom of the ranking because they are new. They are at the bottom because they suck at what they do!
- The question(s) you have to ask about the entire team is:
- Did I hire them this way?
- Did I make them this way?
- This applies to every quintile that you look at.
So, getting back to the title – The Impact on Revenue, Profit and Growth - consider the following:
- What is it costing you to carry those that are failing to perform – in real dollars and lost opportunity? You MUST calculate the cost as if you were reporting this to the board!
- What would the impact be to the bottom line if you fired them all today? Certainly, sales would not suffer. Also, you have to consider that if they are this bad at selling, what else are they bad at and what is that costing you?
- What is the financial impact of those that looked like your worse performers but have exited over the last 12 to 24 months? Those that you fired or exited? What did that cost you in time, training, recruiting dollars, on boarding, compensation AND lost opportunities?
- How many training dollars will you pour down the rat hole attempting to fix people that are un-trainable or un-coachable? What impact could you have if those resources were redirected to sales management improvement, more focus on developing new hires with skills and true potential, recruiting talent that mimics your current top performers?
- What is the impact of keeping non- and low performers on the team? How do those in the middle react to the stack ranking knowing that those on the bottom are not at risk of losing their jobs? Why should they worry?
Okay, so maybe I’ve beat this drum enough – you got the point. What’s the solution, what am I getting to, how do you (as the person responsible for revenue and growth) make sure you are making wise decisions when it comes to hiring, managing and developing talent?
DON’T GO IN BLIND
Think “doctor”. I just completed an abdominal biopsy. Prior to the procedure last Friday, I had a CAT scan, a Pet Scan, Ultrasound and another CAT scan plus results from the same test taken a year ago.
I’m glad Dr. Max didn’t go in blind. It was tough enough even with all the data he had. Without it, there would have been virtually no chance to get it right. That’s the point. Don’t go in blind. Assess your talent, assess your new candidates, know what makes your current successful people successful and know why those that are failing are failing – DON’T REPEAT.

Additional Resources:
- Contact us to find out how to properly assess talent – Jeni@anthonycoletraining.com
- Contact us to have an 80/20 discussion – call me at 513.226.3913 or text. Subject line: 80/20 and then make sure to include your name.
- Request an SEIA demo – traci@anthonycoletraining.com