Let’s talk about why data matters when recruiting people that WILL sell versus CAN sell. There is a big difference.
There are people currently on your team that can sell, but don’t. And for the life of you, you don’t know why. When you hired them, you certainly didn’t think they would occupy the bottom of your stack ranking or the extreme left of your sales production bell curve, but there they are. So, what happened? But first:
What, you don’t have a stack ranking or a sales production bell curve? Click this link to explore: Building a Sales Managed Environment
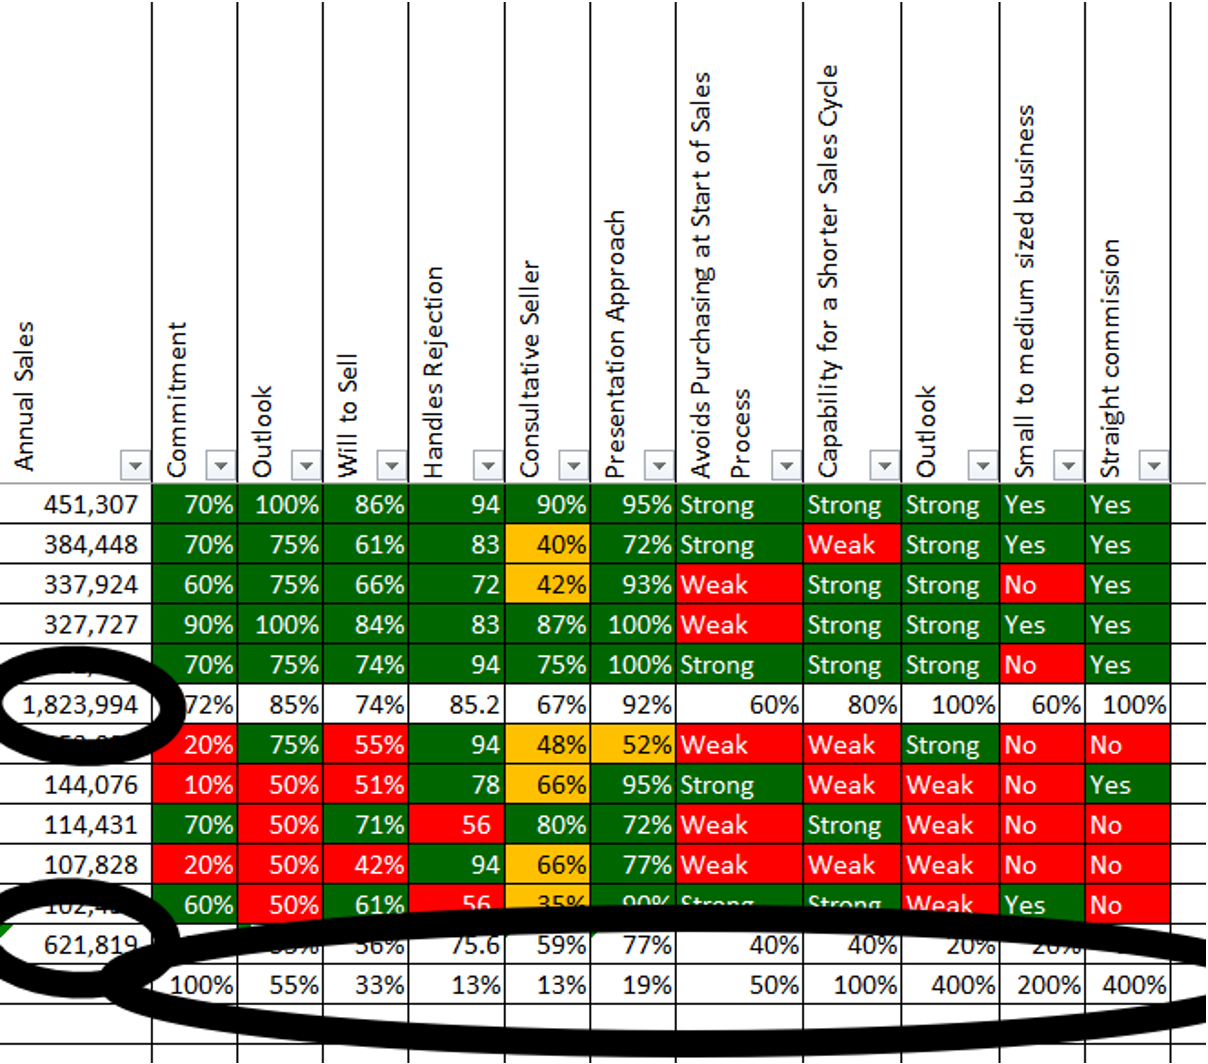
I will show you what happened in this first figure. Here are the instructions:
- Don’t get hung up on words.
- Look at the colors. (Red means weakness hindering sales success, green means strength supporting sales success.)
- Look at colors in the circle.
- Look at the data I give you about the graphic.

Using the Objective Management Group Sales Force Assessment, we analyzed a top 10 insurance brokerage agency with producers across the country. I’ve ranked them here based on the potential each of the brokers had. The calculation was done using their current production information provided by the client, and the sales improvement quotient provided by the assessment. The predictive index of the assessment is 92%. In other words, you can take it to the bank if it tells you someone WILL sell and grow or if you CANNOT expect someone to SELL or Grow.
I circled the areas you see here to demonstrate that the top performers / those with greatest potential and the bottom performers have some characteristics, traits, habits, beliefs, and skills in common. As an example, you might think that those at the top of the production stack ranking would be stronger in desire, commitment, and responsibility. NOT THE CASE – View the first circle to the left.
And so, it is with all those areas where you see a mass of green. These are the things that all 50 had in common. What separates the best from the rest? This graphic!
How much better are the top 5 assess in key differentiators?
- Commitment – 100%
- Outlook – 75%
- Will to sell – 33%
- Handling rejection – 13%
- Consultative selling- 13%
- Presentation approach -19%
- Avoid purchasing agents -50%
- Capable of short sales cycle -100%
- Outloook – 400%
- Selling to small business – 200%
- Working straight commission – 400%

Tony, what does it matter? It means that the top performers have the potential to outperform your bottom performers 3 to 1. (Look at the small circles. The opportunity for the top 5 is 1,823,994$)
When you look at this list, you have to ask: How important are these things for success in my organization?
Back to the title – Why data matters. Data matters if you have efficiency numbers that are critical to your success, if margins are thin and competition is fierce. It matters if you are investing dollars in training, marketing and IT and the bottom group is sucking up time, money and effort and being outperformed 3 to 1.
Here’s the real story. The real opportunity is in the middle group. I’m not suggesting that you fire those at the bottom, but it wouldn’t be the worse idea. I am suggesting that you do the following:
- Have a better hiring process and candidate selection process. Free evaluation of your salespeople using the number 1 sales candidate assessment in the world here
- Have a milestone centric on-boarding process used for all salespeople regardless of pedigree, years of service.
- Have workflows and checklist for sales so that you can clearly and early identify where your salespeople need additional help in prospecting, qualifying, closing and presenting.
- Contact us for more information about how a ‘Stats Finder’ can help you better understand your sales force and how it compares to others in your industry AND a 1 hour consultation here


